Greater Wellington Regional Council Climate Change Mapping 3D viewer prototype Information Help Background

Sea Level Rise and Storm Surge Modelling


This website shows a dynamic map of areas in the Greater Wellington region that will be affected by sea level rise.

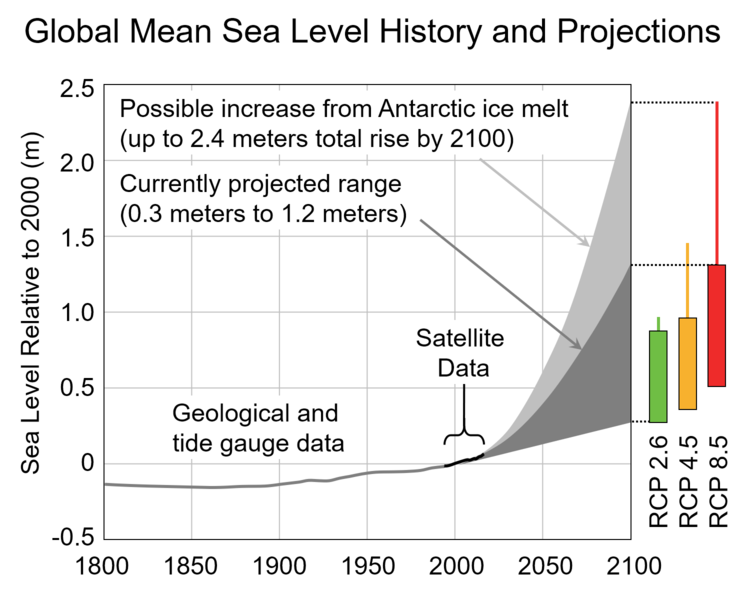
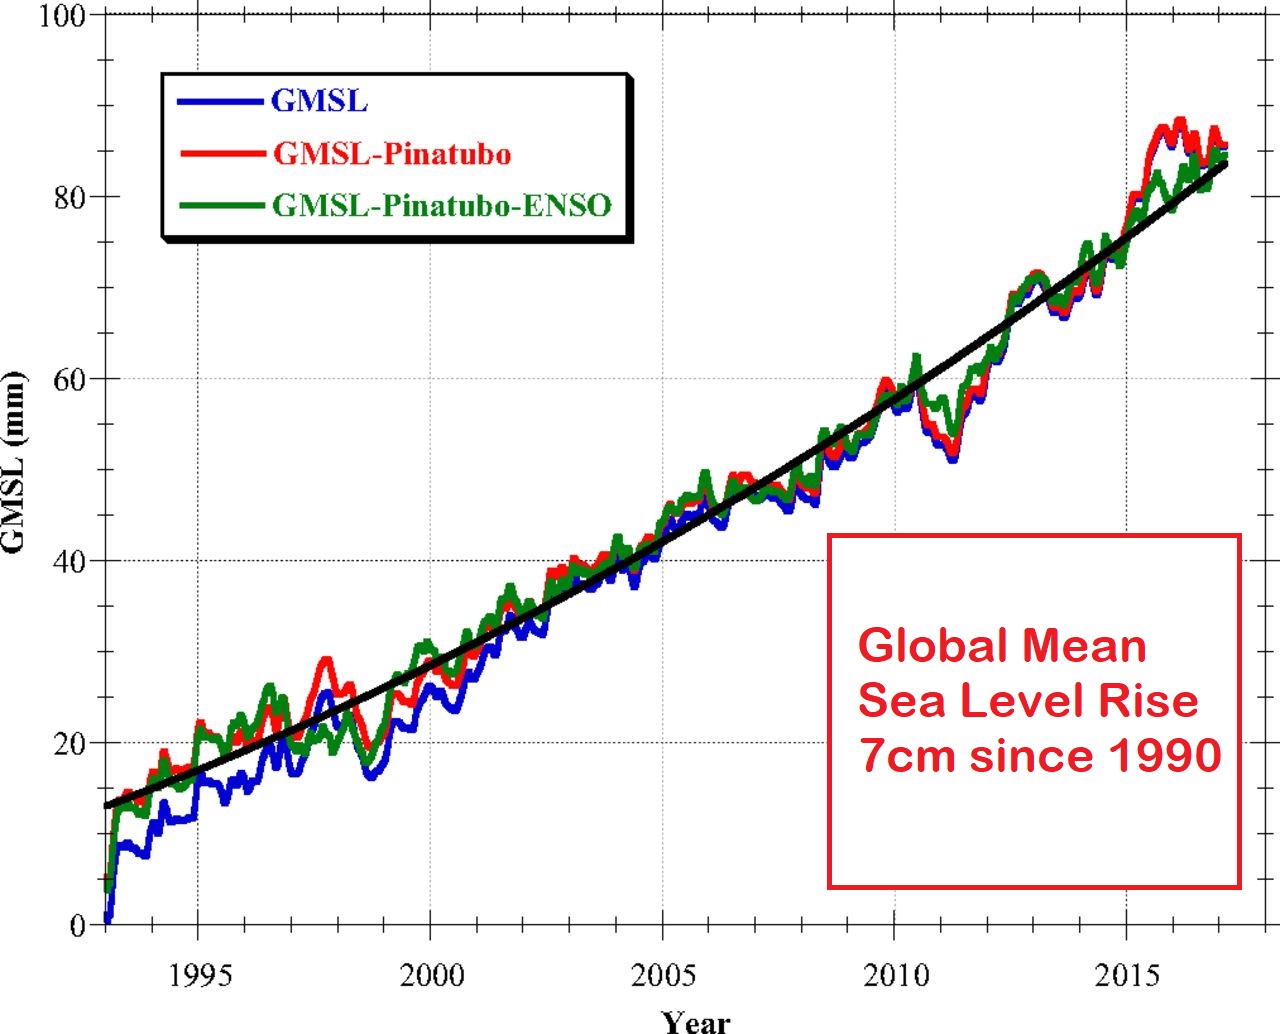
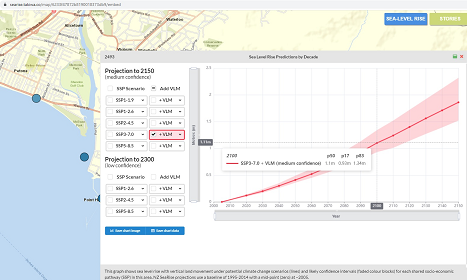
Sea level is known to be rising in the Wellington Region as elsewhere in the world. Currently sea level is rising at about 3mm per year in the region.

However sea levels rise is expected to accelerate in the near future due to climate change. Predictions vary but more information is listed here.

Use the slider bar at the side to match your chosen water level.
Explore the susceptibility of inundation by moving the slider up and down.

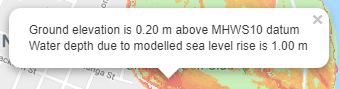
All levels are relative to Mean High Water Springs 10 (MHWS10)
MHWS10 is the mean high water spring tide exceeded 10 percent of the time.
It is often used as a practical high tide level for infrastructure design works, and also for estimating extreme high storm tides.
Learn more about tide levels.

Areas of inundation due to sea level rise were modelled in 2018 based off a detailed digital elevation model (DEM) of the Wellington Region. Learn more.

Areas around Wellington Harbour were updated in 2021 based off updated LIDAR elevation datasets from HCC (2016) and WCC (2020).

Tide level offsets are based on values in a report produced by NIWA for the Parliamentary Commissioner for the Environment in 2016.

Data accuracy for the Wellington CBD area is discussed in a note here.

SLR spectrum image Extreme value
2100
Max likely value
2100
Min likely value
2100

Sea Level Rise Modelling

Sea Level Rise predictions


Global average sea level has risen by about 16–21 cm since 1900,with almost half this rise occurring since 1993 as oceans have warmed and land-based ice has melted.

Relative to the year 2000, sea level is very likely to rise 0.3 to 1.3 m by the end of the century.

Emerging science regarding Antarctic ice sheet stability suggests that, for higher scenarios, a rise exceeding 2.4 m by 2100 is physically possible, although the probability of such an extreme outcome cannot currently be assessed.
(U.S. Global Change Research Program Fourth National Climate Assessment, 2018)

Historical sea level reconstruction and projections up to 2100 published in January 2017
by the U.S. Global Change Research Program for the Fourth National Climate Assessment.

Adaptation Modelling


How we respond to sea level rise and coastal hazards is complex, challenging, and emotive. The options that we choose and the decisions that we make will impact on the places that we live, work, play, and value – both now and for future generations.

NIWA Taihoro Nukurangi has developed Adaptive Futures, a 'serious game' designed to introduce players to local level decision-making on climate change adaptation. This type of educational game simulates the real-life complexities of making these challenging decisions. It’s a useful tool to demonstrate the difficulties of coastal management.

Play NIWA's Adaptive Futures Game Adaptive Futures Game

Recent Sea Level Rise

Global average sea levels have risen about 7cm since 1990.

Global Mean Sea Level (GMSL) for the period 1993 to 2018, as measured by satellite altimetry. Data in blue, trendline in black.
From R. S. Nerem et al. PNAS 2018;115:9:2022-2025. ©2018 by National Academy of Sciences.

How to use this page

Change map content

  • Click on the map window and drag to change the map view.
  • Use zoom tools or shift-click and drag to change the map extent
  • Use the slider bar to change the modelled inundation level (sea level rise), or click a radio button to change the sea level model used for storm surge.
  • Click on an inundation area (coloured map overlay) to view water depth details

Other tools

  • Click on the map to view the calculated values at any location
  • Click on the search tool and enter a name to find any placename in the region
  • Click on the layer control tool and choose an option to change the basemap type or overlays

Adjusting local sea level rise scenarios for land movement

Local SLR predictions

  • Predictions of sea level rise values vary both by location and the chosen model for future climate change.
  • Currently, much of the coast of the Wellington Region is continually subsiding due to seismic effects. The effects of this subsidence should be included to refine the likely value for sea level rise at a future date.
  • A new website released in May 2022 by NZ SeaRise shows sea-level rise and vertical land movement (VLM) incorporated under potential climate change scenarios.
  • The site shows interactive graphs for points along the coast. We recommend use of this website to obtain a likely SLR value (in metres) for a given location, future date, and selected climate change scenario.

NZ SeaRise Map - predictive graph of SLR including vertical land movements.

Worked example

  • Open the NZ SeaRise maps and accept the Disclaimer
  • Zoom the map to your coastal location of interest
  • Click on a blue dot to view the graph
  • Choose a Climate Scenario (SSP) including vertical land movement (VLM)
  • Rest the cursor on the graph line to read the projected SLR for a given year
  • You can then use the current webpage (return to map at top) to view the flooding extent for this SLR value

Background to this page

Background

This webpage displays a dynamic map which shows the calculated inundation areas at a range of sea level rise values in the Wellington Region. Alternative map overlays show modelled storm surge flooding at different sea level rise values, for a 1% AEP (100 year) event. Inundation areas were modelled in 2017 based off a detailed digital elevation model (DEM) of the Wellington Region. Tide level offsets are based on values in a report produced by NIWA for the Parliamentary Commissioner for the Environment in 2016.

Elevation values

The basis for this mapping is a detailed digital elevation model (DEM) of the Wellington Region. This was based off a laser airborne (LIDAR) survey commissioned by the WAGGIS consortium in 2013. The survey data was subsequently reprocessed in 2017 by Landcare Research with funding from LINZ. Areas around Wellington Harbour were updated in 2021 based off updated LIDAR elevation datasets from HCC (2016) and WCC (2020). The DEM was then recalculated to match the MHWS10 datum based off tidal values provided in a NIWA report. Colour overlays on the map show elevations at 20cm intervals above MHWS10.

Report and Data

This website follows on from a report produced by NIWA for the Parliamentary Commissioner for the Environment (PCE) in 2016. Data produced as an outcome of that report can be downloaded from the GWRC Open Data Site.

Please note

Please note these results are based on modelled data, and as such they are indicative only of likely changes, depending on future greenhouse gases emissions.

Scenario choice

It’s impossible to know which sea level rise estimate will be closer to reality by the end of the century, and therefore it is recommended that people’s planning incorporates a range of outcomes.

Disclaimer and Adaptation Discussion

Disclaimer

Climate change is already having large and substantial impacts all over the world. Inter-disciplinary links, such as between climate, health and ecology, are becoming more obvious to researchers, as our knowledge progresses. One of the key results of climate science is that carbon emission reductions and adaptation to unavoidable changes are urgently needed efforts. Paradoxically however, society is still operating under a false paradigm that climate science talks about future, perhaps distant events of high impact.

The reality is that climate change impacts are happening right now, and our society is already changing because of them. A recent paper on climate extremes attribution has shown that decreased winds are causing more marine heatwaves, and that there is a seven-fold increase in wild fire risk in continental regions due to climate change (Herring et al., 2021). Importantly, a paper by the Harvard School of Medicine shows that Covid19 may be linked to the root causes of climate change, including air pollution and biodiversity loss. These are not future projections. They represent impacts that have already been happening over the last two decades all over the planet. Covid19, for example, has already significantly changed our society, further highlighting the importance of maintaining healthy ecosystems for our own survival.

While sea level is rising relatively slowly, further rises are certain, as a function of excess CO2 in the atmosphere that has already been committed. While nobody knows how much sea level will rise by the end of the century, the certainty that it will continue to rise means that a responsible action demands that we investigate and act accordingly, based on acceptable risks. We need to explore, therefore, what the potential impacts of various levels of change might be for our region.

As such, the SLR tools developed or endorsed by GWRC (both 2D and 3D) are not an attempt to predict exactly what is going to happen. The tools are simply an approximate attempt to graphically illustrate an example of sea water levels, and potential associated impacts, during extreme high tides under different arbitrary sea level rise scenarios. The modelling here presented has not been checked against more realistic ‘dynamic’ scenarios, and so real world impacts could be worse in certain areas and less acute in other areas. While the maps cover local details making use of the best available mapping technology to us, it must not be used to inform specific local policy and mitigation decision without further and more targeted dynamical model simulations.

References

Harvard School of Public Health: Coronavirus and climate change

Herring et al., 2021: Explaining Extreme events of 2019 from a climate perspective. Special Supplement to the Bulletin of the American Meteorological Society, vol. 102, number 1

Adaptation and Mitigation – The role of civic duty

Our communities are the co-creators of our reality. While scientists and policy makers can attempt to provide guidance and answers, ultimately the people must decide how they wish to live.

This tool is a platform to help people visualise and discuss potential impacts in their communities. As explained in the disclaimer, we are not attempting to predict what is going to happen. The real impacts may be less severe, or more severe, depending on specific local details and actual sea level rise levels. No model can tell us exactly how much sea level will rise, other than our virtual certainty that it will continue to rise for decades to come.

At the heart of the matter, lies the civic duty and rights of every citizen of being duly informed about what pathways might lie ahead. Society is used to abruptly changing in the face of risks. Our response to Covid-19 is just one example of such a process. When change is gradual, it is much easier to cope with.

The science is clear that if we do nothing, sea level will continue to rise for centuries to come, and potentially rise to several metres above present levels. On the other hand, if we stop emissions now, much of the higher end rises can still be mitigated, meaning less disruptive levels of increase. SLR is an urgent, imminent threat, and a certain amount of SLR is inevitable, but action can be taken to reduce the total increase.

Therefore, our community has the rights to demand that risk is assessed, and action is taken, in order to mitigate the higher end scenarios and to adapt to unavoidable changes.

  1. Talk to your local elected member and council, and demand transparency and social justice in the context of climate action
  2. Learn as much as you can about climate projections for our region
  3. Investigate the impact of consumer’s choice on the environment
  4. Speak up to protect our local native forests, waterways and ecosystems, as they lie at the very fabric of our climate resilience and future life
  5. Consider your impact on the environment, and in particular the impact of car drive and unnecessary travel
  6. Think about how much sea level rise risks are acceptable for your area. Get informed about the true costs of fortification to defend the status quo, and whether this is a desirable long-term solution
  7. Consider managed retreat options, and how these could possibly work to our longer-term benefit
  8. Be open to consider change as a positive thing. It might not be as negative or difficult as it sounds.